One tool I used for custom type access log analysis (logs generated by the Glassfish application server) is Nihuo Web Log Analyzer. I found this tool very simple, easy to configure and very good in analyzing custom log files. The reports generated by this tool are also very good. It can be downloaded from
http://www.loganalyzer.net/download.html
In my case the Glassfish application server was behind Netscaler load balancer. To get actual client IP from load balancer into Glassfish server please go through my blog post: Netscaler Load Balancer – Forwarding client IP to the Glassfish Server
How to enable customized access logs in Glassfish server go through my post: Enabling HTTP access log in Glassfish
After installing Nihuo Web Log Analyzer, I am ready to analyze the log files of my website.
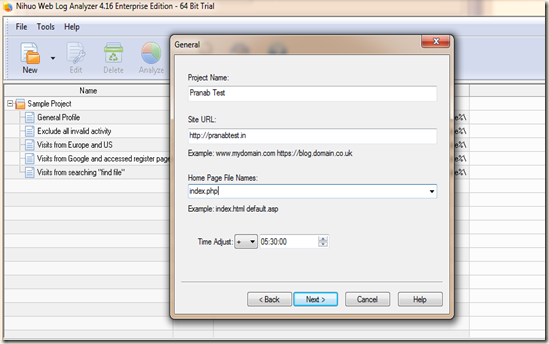
To analyze, I am going to create a project. Click on New button and click on New Project
Enter the project name, URL of the website (we will analyze logs of this website) and home page of the website. Also if required adjust the time according to you timezone.
I have downloaded the log files into my local drive and I will analyze it in my local system. So I will choose Local File in how to retrieve your log files. I am getting custom type access log file in my Glassfish server. As to capture the actual client IP from the load balancer I had to use a custom header field. For reference you can read my post http://pe-kay.blogspot.in/2011/08/netscaler-load-balancer-forwarding_5553.html
I configured Glassfish access log as
%header.Client-IP% %datetime% %request% %user.agent% %status% %response.length% %referer%
The access log file content generated by Glassfish is as follows:
"27.4.144.69" "13/Jun/2012:06:33:40 +0530" "GET /images/header.gif HTTP/1.1" "Mozilla/5.0 (Windows NT 6.1; WOW64) AppleWebKit/536.5 (KHTML, like Gecko) Chrome/19.0.1084.56 Safari/536.5" 200 3014 "http://pranabtest.in/"
Select the Log file format as Apache/NCSA Custom Log and click on Custom button to enter the custom log format
In my case the log format will be like
\"%h\" "\%t\" \"%r\" \"%{User-agent}i\" %>s %b \"%{Referer}i\"
Next we have to select the log files, we can select multiple log files here.
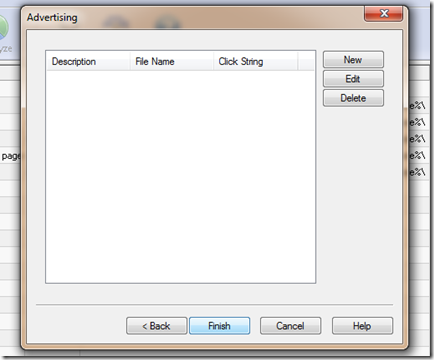
Click Finish to save the project.
As we save the project, the software will give us alert to start the analysis of the log files. Click Yes button to start the log analysis process.
Report generation is completed and we can view the report now.
That’s all, we can now view the comprehensive reports provided by Nihuo Web Log Analyzer.
It’s very easy and fast .


1 comment:
I have used this software for years. It's difficult to use. I must have clicked the wrong thing; now, after a bit the program just displays logs' over a blank display, with 'refresh', 'clear', and 'close' buttons at the bottom. It must be pointing at the wrong place, or have something missing. It can't be that difficult to mend! It's infuriating!
Rae West
[an email is raetowest at-symbol protonmail.com Thanks!
Post a Comment