Many times for some testing we need to start a MongoDB sharded cluster. It is very tedious to manually starting all the config servers, shards and mongos. I wrote a shell script which creates the test sharded MongoSB cluster in a single machine. The script is available in my github account https://github.com/pranabsharma/scripts/blob/master/mongodb/create_shard.sh
Showing posts with label MongoDB. Show all posts
Showing posts with label MongoDB. Show all posts
Saturday, 5 August 2017

Tuesday, 27 June 2017
MongoDB Recipes: Change mongod’s log level
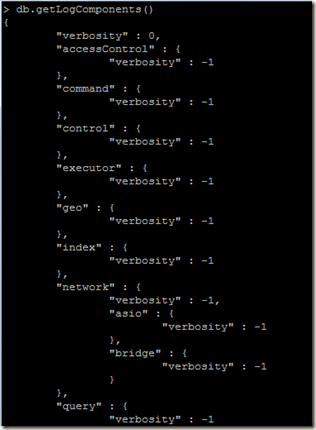
To view the current log verbosity levels, use the db.getLogComponents() method.
In the below mongod instance, the verbosity is 0 (default informational level). Here we can see that the verbosity of individual components are -1, this means the component inherits the log level of its parent.
We can configure log verbosity levels by
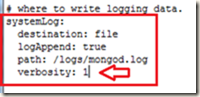
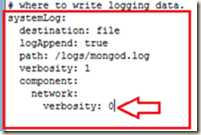
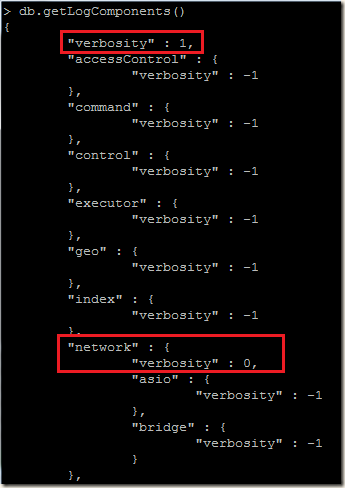
Also we can change verbosity level of an individual log component using the systemLog.component.<name>.verbosity setting for that component.
For example we are changing the verbosity level of network component to 0.
systemLog.component.network.verbosity
Example, we are going to set the default verbosity level to 2, verbosity level of storage to 1, and the storage.journal to 0
> use admin
> db.runCommand( { setParameter: 1, logComponentVerbosity:
{
verbosity: 2,
storage: {
verbosity: 1,
journal:
{
verbosity: 0
}
}
}
} )
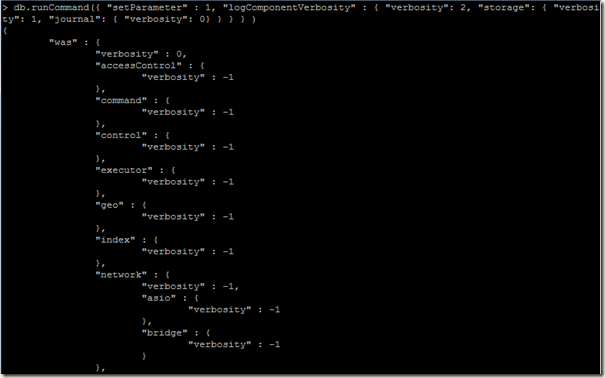
Example:
In the below mongod instance, the verbosity is 0 (default informational level). Here we can see that the verbosity of individual components are -1, this means the component inherits the log level of its parent.
We can configure log verbosity levels by
- Method 1: Using mongod’s startup settings
- Method 2: Using the logComponentVerbosity parameter
- Method 3: Using the db.setLogLevel() method.
Method 1:
We can configure global verbosity level using: the systemLog.verbosity settingsAlso we can change verbosity level of an individual log component using the systemLog.component.<name>.verbosity setting for that component.
For example we are changing the verbosity level of network component to 0.
systemLog.component.network.verbosity
Method 2:
To change log verbosity level using the logComponentVerbosity parameter, pass a document with the required verbosity settings.Example, we are going to set the default verbosity level to 2, verbosity level of storage to 1, and the storage.journal to 0
> use admin
> db.runCommand( { setParameter: 1, logComponentVerbosity:
{
verbosity: 2,
storage: {
verbosity: 1,
journal:
{
verbosity: 0
}
}
}
} )
Method 3:
We can use the db.setLogLevel() method to update a single component’s log level.Example:
- Change the default verbosity level to 0:
- Change the storage.journal log level to 4:


Wednesday, 7 June 2017
MongoDB Receipes: Change chunk size in a shared cluster
The default chunk size in a shared cluster is 64MB. If we want to change it to a smaller/larger size (the allowed range of the chunk size is between 1 and 1024 MB):
Start the mongos with sharding.chunkSize (using config file) or --chunkSize (command line option) and set this option to desired chunk size value.
Method 1:
This method works before/after the shared cluster is initialized and is recommended method- Login to any mongos of the shared cluster:
- To change the global chunk size, update the value field of chunksize in the config database, here we are changing the chunk size to 5MB:


Method 2:
This method works only when you initialize the cluster for the first time. After the cluster is initialized, this method will not change the chunk size of the cluster.Start the mongos with sharding.chunkSize (using config file) or --chunkSize (command line option) and set this option to desired chunk size value.
Friday, 19 May 2017
MongoDB Recipes: Disable replica set chaining
By default MongoDB allows replica set chaining. That means it allows a secondary member to sync from another secondary. Suppose we want our secondaries only to sync from the primary not from any other secondary. In that case we can disable replica set chaining.

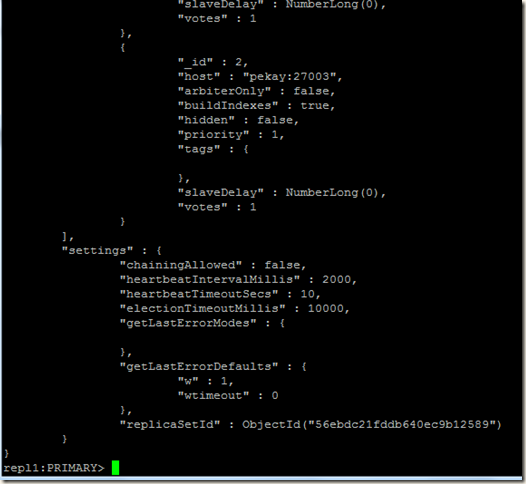
- Save replica set configuration in a variable:
repl1:PRIMARY> cfg = rs.conf()
- If settings sub-document is not present in the config, then add it:
repl1:PRIMARY> cfg.settings = {} - Set the chainingAllowed property to false from default value true in the cfg variable
repl1:PRIMARY> cfg.settings.chainingAllowed = false - Set the new configuration from cfg variable
repl1:PRIMARY> rs.reconfig(cfg) - Check the new settings:
repl1:PRIMARY> rs.conf()
Friday, 24 June 2016
MongoDB inaccurate count() after crash
One of my MongoDB dev database server had crashed due to abrupt power failure. I was running MongoDB 3.2.4 with WiredTiger storage engine. I had one user collection in my test database; and at the time of server crash, inserts were going on from a loop into this collection.
I started back the server; MongoDB did recovery from last checkpoint and it started fine.
2016-06-24T09:53:47.113+0530 W - [initandlisten] Detected unclean shutdown - /data/db/mongod.lock is not empty.
2016-06-24T09:53:47.113+0530 W STORAGE [initandlisten] Recovering data from the last clean checkpoint.
After the server had started, I tried to check the number of documents that got inserted into my users collection, so I run the db.collection.count() and seeing the result I was stunned.
> db.users.count()
7
> db.users.find({}).count()
7

Then I run db.collection.stats() that too also confirmed the previous results

This result was not correct, as previously I had 7 documents in the users collections (before the insert operation was started). At the time of crash as the insert operations were going on, so the number documents should have increased. So where the document from my new inserts had gone????? Immediately I felt the fear of data loss or corruption.
I run aggregate method with $group to check the number of docs and result was encouraging:
> db.users.aggregate({ $group: { _id: null, count: { $sum: 1 } } })
{ "_id" : null, "count" : 27662 }

My data was there, so the fear of data loss went away . That means the issue was with the count() and stats() results.
Then I checked the MongoDB documents and I found that, if the MongoDB instance using WiredTiger storage engine had unclean shutdown, then the statistics on size and count may go wrong.
To restore and correct the statistics after an unclean shutdown, we should run the validate command or the helper method db.collection.validate() on each collection of the mongod.
Then I run the db.collection.validate() method on my users collections:

After that I run the count() method, it gave me correct results:
> db.users.count()
27662

Tip: Don’t always rely on count() or stats() methods, run aggregate() with $group to get the document count if you have any doubt. Also on sharded cluster, it is always better to run aggregate() with $group to get the count of documents.
I started back the server; MongoDB did recovery from last checkpoint and it started fine.
2016-06-24T09:53:47.113+0530 W - [initandlisten] Detected unclean shutdown - /data/db/mongod.lock is not empty.
2016-06-24T09:53:47.113+0530 W STORAGE [initandlisten] Recovering data from the last clean checkpoint.
After the server had started, I tried to check the number of documents that got inserted into my users collection, so I run the db.collection.count() and seeing the result I was stunned.
> db.users.count()
7
> db.users.find({}).count()
7

Then I run db.collection.stats() that too also confirmed the previous results

This result was not correct, as previously I had 7 documents in the users collections (before the insert operation was started). At the time of crash as the insert operations were going on, so the number documents should have increased. So where the document from my new inserts had gone????? Immediately I felt the fear of data loss or corruption.
I run aggregate method with $group to check the number of docs and result was encouraging:
> db.users.aggregate({ $group: { _id: null, count: { $sum: 1 } } })
{ "_id" : null, "count" : 27662 }

My data was there, so the fear of data loss went away
. That means the issue was with the count() and stats() results. Then I checked the MongoDB documents and I found that, if the MongoDB instance using WiredTiger storage engine had unclean shutdown, then the statistics on size and count may go wrong.
To restore and correct the statistics after an unclean shutdown, we should run the validate command or the helper method db.collection.validate() on each collection of the mongod.
Then I run the db.collection.validate() method on my users collections:

After that I run the count() method, it gave me correct results:
> db.users.count()
27662

Tip: Don’t always rely on count() or stats() methods, run aggregate() with $group to get the document count if you have any doubt. Also on sharded cluster, it is always better to run aggregate() with $group to get the count of documents.
Monday, 30 May 2016
JOIN in MongoDB ? or JOIN’s kin? or something similar?
One of the sought after features in MongoDB was to have the ability to join collections. People working on RDBMS were very much familiar with joins and could not even imagine working without joins. The base of RDBMS is the relations, and join is one of the success factors of RDBMS. Also the join is the one of the major performance issues in RDBMS when we have large amount of data. MongoDB is based on document model, most of the time all the data for a record is located in a single document. So if the data is properly modelled in MongoDB the need for Joins can be avoided. For some requirements like reporting, analytics etc. it is possible that the data we need may reside in multiple collections. As MongoDB user base is growing and more and more users from RDBMS world are using MongoDB, so requirement of Join came out strongly. Starting with MongoDB version 3.2, one new aggregation framework operator $lookup was added. The $lookup operator performs an operation similar to a Join (left outer join). We can read data from one collection and merge the data with data from another collection. Prior to MongoDB 3.2, similar work had to be implemented in application code.
Let’s get our hands dirty with an example.
Suppose we have two collections:
users collection stores user’s information.

activity collection stores users activities.

Referring to RDBMS, we may think userID field in users collection as the primary key and userID field in activity collection as the foreign key . So the link between these users and activity collection is the userID field.
Now suppose we got a requirement: “find username and city of the user performing each activity”. But the user’s detail information is stored in users collection, so we have to join the activity and users collections using the userID field to extract the required data.
It’s the time to leverage the power of $lookup operator. So our aggregation query will be:
> db.activity.aggregate(
{
"$lookup": {
from : "users",
localField : "userID",
foreignField: "userID",
as : "userInfo" }
})
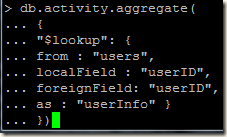
from: Specifies the collection from the current database to be joined, in our example it will be the users collection.
localField: Specifies the field from the input documents, in our case it will be userID field of activity collection.
foreignField: Specifies the field from the documents of the “from” collection, in our case it will be userID from users collection.
as: Specifies the name of the new array field, each array contains the matching documents from the “from” collection. We are naming this array as userInfo.

From above output, we can see that the whole users document is stored within the userInfo array.
The data returned above is not looking cool, this is not the format in which we wanted the data. If we get data in the following format, it would be nice:
UserID, Activity, UserName, City
So for that we have to use two more aggregation framework operators, $unwind and $project, let’s rewrite our aggregation query:
> db.activity.aggregate(
{
"$lookup": {
from : "users",
localField : "userID",
foreignField: "userID",
as : "userInfo" }
},
{
"$unwind": "$userInfo"
},
{
"$project": {
"UserID":"$userID",
"UserName" : "$userInfo.username",
"City" : "$userInfo.city",
"activity" : 1,
"_id": 0 }
}
)

Voila, required data is ready
Let’s get our hands dirty with an example.
Suppose we have two collections:
users collection stores user’s information.

activity collection stores users activities.

Referring to RDBMS, we may think userID field in users collection as the primary key and userID field in activity collection as the foreign key
. So the link between these users and activity collection is the userID field.Now suppose we got a requirement: “find username and city of the user performing each activity”. But the user’s detail information is stored in users collection, so we have to join the activity and users collections using the userID field to extract the required data.
It’s the time to leverage the power of $lookup operator. So our aggregation query will be:
> db.activity.aggregate(
{
"$lookup": {
from : "users",
localField : "userID",
foreignField: "userID",
as : "userInfo" }
})

from: Specifies the collection from the current database to be joined, in our example it will be the users collection.
localField: Specifies the field from the input documents, in our case it will be userID field of activity collection.
foreignField: Specifies the field from the documents of the “from” collection, in our case it will be userID from users collection.
as: Specifies the name of the new array field, each array contains the matching documents from the “from” collection. We are naming this array as userInfo.

From above output, we can see that the whole users document is stored within the userInfo array.
The data returned above is not looking cool, this is not the format in which we wanted the data. If we get data in the following format, it would be nice:
UserID, Activity, UserName, City
So for that we have to use two more aggregation framework operators, $unwind and $project, let’s rewrite our aggregation query:
> db.activity.aggregate(
{
"$lookup": {
from : "users",
localField : "userID",
foreignField: "userID",
as : "userInfo" }
},
{
"$unwind": "$userInfo"
},
{
"$project": {
"UserID":"$userID",
"UserName" : "$userInfo.username",
"City" : "$userInfo.city",
"activity" : 1,
"_id": 0 }
}
)

Voila, required data is ready
Saturday, 21 May 2016
Index Filters in MongoDB
MongoDB query optimizer processes queries and pick out the most efficient query plan for a query. MongoDB query system uses this plan each time the query runs. MongoDB optimizer chooses the optimal index (if indexes are available) for a query.
MongoDB optimizer works very well but sometimes we may have a better idea of which index to use for a given query. We can run the hint() method on a query to override query optimizer’s index selection process and tell the system which index should be used for the given query. So we have to specify hint() method from client side every time we want to override the index selection process. Sometimes we may have better idea about a query and the index to be used for that query and also we don’t want end user to override the index selection process by providing hint(). For all these the solution is Index Filters.
Index filter provides us a temporary (index filter do not persist after shutdown) way to inform MongoDB that a particular query type should use particular index. It determines which indexes the optimizer evaluates for a query shape (a query shape consists of the query itself, any sort criteria and any projection specifications). So if we have specified an index filter for a specific query type, then we don’t have add hint() to the same query. Also hint() is ignored by MongoDB when index filter exists for the particular query shape.
I will show one example to clarify the concept.
I have one collection users, having following data:
{ "userID" : 1001, "name" : "Pranab Sharma", "city" : "Mumbai", "favFood" : "Chinese", "favDrink" : "beer" }
{ "userID" : 1002, "name" : "Danish Khan", "city" : "Guwahati", "favFood" : "Chinese", "favDrink" : "beer" }
{ "userID" : 1003, "name" : "Samir Das", "city" : "Mumbai", "favFood" : "Continental", "favDrink" : "milk" }
{ "userID" : 1004, "name" : "John Butler", "city" : "Mumbai", "favFood" : "Indian", "favDrink" : "vodka" }
{ "userID" : 1005, "name" : "Xi Xen", "city" : "Guwahati", "favFood" : "Chinese", "favDrink" : "wine" }
{ "userID" : 1006, "name" : "Vladimir Pulaxy", "city" : "Guwahati", "favFood" : "Chinese", "favDrink" : "beer" }
{ "userID" : 1007, "name" : "Karina Ali", "city" : "Mumbai", "favFood" : "Mexican", "favDrink" : "beer" }
This collection has two user defined indexes:
db.users.find({"userID" : {"$gte": 1003}, "favDrink": "beer"}).sort({"city": 1})
After running the query, if we check the execution stats of the query in MongoDB’s log (set the log level to 1 to get execution stats of the query using the command: db.adminCommand({setParameter:1, logLevel:1} ) :
[conn1] command test.users command: find { find: "users", filter: { userID: { $gte: 1003.0 }, favDrink: "beer" }, sort: { city: 1.0 } } planSummary: IXSCAN { userID: 1.0, city: 1.0 } keysExamined:5 docsExamined:5 hasSortStage:1 cursorExhausted:1 keyUpdates:0 writeConflicts:0 numYields:0 nreturned:2 reslen:342
From the above log line, we can see that the query optimizer has choosen the index { "userID" : 1, "city" : 1 } for our query. It scanned 5 index entries and 5 documents scanned.
Suppose, we know that if we use the index {"userID":1, "favDrink": 1 } for this query, then the system will require less number of document scanning. Let’s run the query providing this index in hint():
db.users.find({"userID" : {"$gte": 1003}, "favDrink": "beer"}).sort({"city": 1}).hint({"userID":1, "favDrink": 1 })
Now the execution stats for this query:
[conn1] command test.users command: find { find: "users", filter: { userID: { $gte: 1003.0 }, favDrink: "beer" }, sort: { city: 1.0 }, hint: { userID: 1.0, favDrink: 1.0 } } planSummary: IXSCAN { userID: 1.0, favDrink: 1.0 } keysExamined:5 docsExamined:2 hasSortStage:1 cursorExhausted:1 keyUpdates:0 writeConflicts:0 numYields:0 nreturned:2 reslen:342
This time MongoDB scanned 2 documents, 3 documents less than our previous attempt without hint().
Say, we want to enforce the use of the index {"userID":1, "favDrink": 1 } for our above query. So we can set an index filter , instead of informing everyone to use the index {"userID":1, "favDrink": 1 } in hint().
To create an index filter, we can use the command planCacheSetFilter. This command has the follwing syntax:
db.runCommand(
{
planCacheSetFilter: <collection>,
query: <query>,
sort: <sort>,
projection: <projection>,
indexes: [ <index1>, <index2>, ...]
}
)
So for our example, the command will be:
db.runCommand(
{
planCacheSetFilter: "users",
query: {"userID" : {"$gte": 1003}, "favDrink": "beer"},
sort: {"city": 1},
projection: {},
indexes: [{"userID":1, "favDrink": 1 }]
} )

Our index filter is in place, now let’s run the query without hint():
db.users.find({"userID" : {"$gte": 1003}, "favDrink": "beer"}).sort({"city": 1})

Checking the execution status of the query:
[conn1] command test.users command: find { find: "users", filter: { userID: { $gte: 1003.0 }, favDrink: "beer" }, sort: { city: 1.0 } } planSummary: IXSCAN { userID: 1.0, favDrink: 1.0 } keysExamined:5 docsExamined:2 hasSortStage:1 cursorExhausted:1 keyUpdates:0 writeConflicts:0 numYields:0 nreturned:2 reslen:342
Yes, we can see MongoDB used the index {"userID":1, "favDrink": 1 } for our query (as we specified in our index filter), so our index filter worked.
To check whether MongoDB really applied an index filter for our query we can use the explain() method and check the indexFilterSet field. If it is set to true, that means MongoDB had applied index filter.
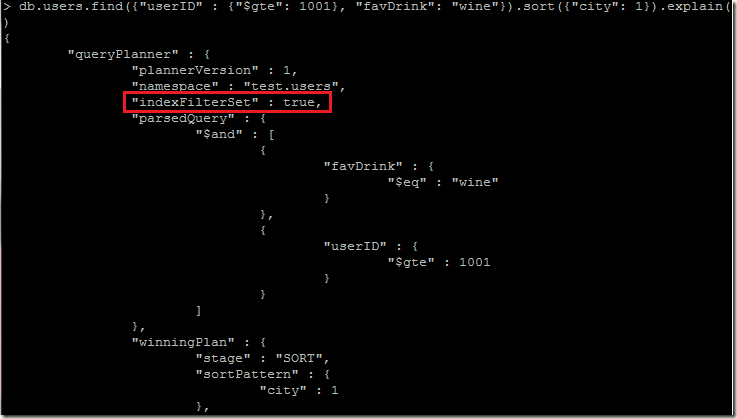
If we can change the comparision value for userID field’s $gte and for favDrink, then also our index filter will work.
Let’s examine:
db.users.find({"userID" : {"$gte": 1001}, "favDrink": "wine"}).sort({"city": 1})

[conn1] command test.users command: find { find: "users", filter: { userID: { $gte: 1001.0 }, favDrink: "wine" }, sort: { city: 1.0 } } planSummary: IXSCAN { userID: 1.0, favDrink: 1.0 } keysExamined:6 docsExamined:1 hasSortStage:1 cursorExhausted:1 keyUpdates:0 writeConflicts:0 numYields:0 nreturned:1 reslen:221
We can see that MongoDB used the index that we specified in the index filter definition. As changing the value does not change the query shape, so MongoDB used that index filter.
But if we change $gte to say $gt or $lt then our index filter will not work and MongoDB will again use the index { "userID" : 1, "city" : 1 }.
Let’s examine:
db.users.find({"userID" : {"$gt": 1003}, "favDrink": "beer"}).sort({"city": 1})
command test.users command: find { find: "users", filter: { userID: { $gt: 1003.0 }, favDrink: "beer" }, sort: { city: 1.0 } } planSummary: IXSCAN { userID: 1.0, city: 1.0 } keysExamined:4 docsExamined:4 hasSortStage:1 cursorExhausted:1 keyUpdates:0 writeConflicts:0 numYields:0 nreturned:2 reslen:342
From above log, we can see that MongoDB used the default index { userID: 1, city: 1 }, as changing $gte to $gt changed the query shape.
Now let’s examine if providing a hint for a query works, if we have index filter in place for that query:
db.users.find({"userID" : {"$gte": 1001}, "favDrink": "wine"}).sort({"city": 1}).hint({ userID: 1, city: 1 })
We provided the { userID: 1, city: 1 } index as a hint to our query.
[conn1] command test.users command: find { find: "users", filter: { userID: { $gte: 1001.0 }, favDrink: "wine" }, sort: { city: 1.0 }, hint: { userID: 1.0, city: 1.0 } } planSummary: IXSCAN { userID: 1.0, favDrink: 1.0 } keysExamined:6 docsExamined:1 hasSortStage:1 cursorExhausted:1 keyUpdates:0 writeConflicts:0 numYields:0 nreturned:1 reslen:221
From the log, it is clear that MongoDB used the { userID: 1, favDrink: 1 } index, it did not consider the index { userID: 1, city: 1 } that we specified in the hint.
We can use the planCacheListFilters command to get the list of index filters for a given collection:
db.runCommand( { planCacheListFilters : "users" })

Also we can run the planCacheClearFilters command to remove a specific index filter or all the index filters in a collection. To remove a specific index filter we have to specify the query shape. For our example:
db.runCommand(
{
planCacheClearFilters: "users",
"query" : {"userID" : {"$gte" : 1003},"favDrink" : "beer"},
"sort": {"city" : 1},
"projection": {}
} )

To clear all index filters on a collection, just omit the query shape in the planCacheClearFilters command:
db.runCommand({planCacheClearFilters: "users"})

Index filter is a very nice tool for optimizing MongoDB experience, so try it out and enjoy .
.
MongoDB optimizer works very well but sometimes we may have a better idea of which index to use for a given query. We can run the hint() method on a query to override query optimizer’s index selection process and tell the system which index should be used for the given query. So we have to specify hint() method from client side every time we want to override the index selection process. Sometimes we may have better idea about a query and the index to be used for that query and also we don’t want end user to override the index selection process by providing hint(). For all these the solution is Index Filters.
Index filter provides us a temporary (index filter do not persist after shutdown) way to inform MongoDB that a particular query type should use particular index. It determines which indexes the optimizer evaluates for a query shape (a query shape consists of the query itself, any sort criteria and any projection specifications). So if we have specified an index filter for a specific query type, then we don’t have add hint() to the same query. Also hint() is ignored by MongoDB when index filter exists for the particular query shape.
I will show one example to clarify the concept.
I have one collection users, having following data:
{ "userID" : 1001, "name" : "Pranab Sharma", "city" : "Mumbai", "favFood" : "Chinese", "favDrink" : "beer" }
{ "userID" : 1002, "name" : "Danish Khan", "city" : "Guwahati", "favFood" : "Chinese", "favDrink" : "beer" }
{ "userID" : 1003, "name" : "Samir Das", "city" : "Mumbai", "favFood" : "Continental", "favDrink" : "milk" }
{ "userID" : 1004, "name" : "John Butler", "city" : "Mumbai", "favFood" : "Indian", "favDrink" : "vodka" }
{ "userID" : 1005, "name" : "Xi Xen", "city" : "Guwahati", "favFood" : "Chinese", "favDrink" : "wine" }
{ "userID" : 1006, "name" : "Vladimir Pulaxy", "city" : "Guwahati", "favFood" : "Chinese", "favDrink" : "beer" }
{ "userID" : 1007, "name" : "Karina Ali", "city" : "Mumbai", "favFood" : "Mexican", "favDrink" : "beer" }
This collection has two user defined indexes:
- { "userID" : 1, "favDrink" : 1 }
- { "userID" : 1, "city" : 1 }
db.users.find({"userID" : {"$gte": 1003}, "favDrink": "beer"}).sort({"city": 1})
After running the query, if we check the execution stats of the query in MongoDB’s log (set the log level to 1 to get execution stats of the query using the command: db.adminCommand({setParameter:1, logLevel:1} ) :
[conn1] command test.users command: find { find: "users", filter: { userID: { $gte: 1003.0 }, favDrink: "beer" }, sort: { city: 1.0 } } planSummary: IXSCAN { userID: 1.0, city: 1.0 } keysExamined:5 docsExamined:5 hasSortStage:1 cursorExhausted:1 keyUpdates:0 writeConflicts:0 numYields:0 nreturned:2 reslen:342
From the above log line, we can see that the query optimizer has choosen the index { "userID" : 1, "city" : 1 } for our query. It scanned 5 index entries and 5 documents scanned.
Suppose, we know that if we use the index {"userID":1, "favDrink": 1 } for this query, then the system will require less number of document scanning. Let’s run the query providing this index in hint():
db.users.find({"userID" : {"$gte": 1003}, "favDrink": "beer"}).sort({"city": 1}).hint({"userID":1, "favDrink": 1 })
Now the execution stats for this query:
[conn1] command test.users command: find { find: "users", filter: { userID: { $gte: 1003.0 }, favDrink: "beer" }, sort: { city: 1.0 }, hint: { userID: 1.0, favDrink: 1.0 } } planSummary: IXSCAN { userID: 1.0, favDrink: 1.0 } keysExamined:5 docsExamined:2 hasSortStage:1 cursorExhausted:1 keyUpdates:0 writeConflicts:0 numYields:0 nreturned:2 reslen:342
This time MongoDB scanned 2 documents, 3 documents less than our previous attempt without hint().
Say, we want to enforce the use of the index {"userID":1, "favDrink": 1 } for our above query. So we can set an index filter
, instead of informing everyone to use the index {"userID":1, "favDrink": 1 } in hint().To create an index filter, we can use the command planCacheSetFilter. This command has the follwing syntax:
db.runCommand(
{
planCacheSetFilter: <collection>,
query: <query>,
sort: <sort>,
projection: <projection>,
indexes: [ <index1>, <index2>, ...]
}
)
So for our example, the command will be:
db.runCommand(
{
planCacheSetFilter: "users",
query: {"userID" : {"$gte": 1003}, "favDrink": "beer"},
sort: {"city": 1},
projection: {},
indexes: [{"userID":1, "favDrink": 1 }]
} )

Our index filter is in place, now let’s run the query without hint():
db.users.find({"userID" : {"$gte": 1003}, "favDrink": "beer"}).sort({"city": 1})

Checking the execution status of the query:
[conn1] command test.users command: find { find: "users", filter: { userID: { $gte: 1003.0 }, favDrink: "beer" }, sort: { city: 1.0 } } planSummary: IXSCAN { userID: 1.0, favDrink: 1.0 } keysExamined:5 docsExamined:2 hasSortStage:1 cursorExhausted:1 keyUpdates:0 writeConflicts:0 numYields:0 nreturned:2 reslen:342
Yes, we can see MongoDB used the index {"userID":1, "favDrink": 1 } for our query (as we specified in our index filter), so our index filter worked.
To check whether MongoDB really applied an index filter for our query we can use the explain() method and check the indexFilterSet field. If it is set to true, that means MongoDB had applied index filter.

If we can change the comparision value for userID field’s $gte and for favDrink, then also our index filter will work.
Let’s examine:
db.users.find({"userID" : {"$gte": 1001}, "favDrink": "wine"}).sort({"city": 1})

[conn1] command test.users command: find { find: "users", filter: { userID: { $gte: 1001.0 }, favDrink: "wine" }, sort: { city: 1.0 } } planSummary: IXSCAN { userID: 1.0, favDrink: 1.0 } keysExamined:6 docsExamined:1 hasSortStage:1 cursorExhausted:1 keyUpdates:0 writeConflicts:0 numYields:0 nreturned:1 reslen:221
We can see that MongoDB used the index that we specified in the index filter definition. As changing the value does not change the query shape, so MongoDB used that index filter.
But if we change $gte to say $gt or $lt then our index filter will not work and MongoDB will again use the index { "userID" : 1, "city" : 1 }.
Let’s examine:
db.users.find({"userID" : {"$gt": 1003}, "favDrink": "beer"}).sort({"city": 1})
command test.users command: find { find: "users", filter: { userID: { $gt: 1003.0 }, favDrink: "beer" }, sort: { city: 1.0 } } planSummary: IXSCAN { userID: 1.0, city: 1.0 } keysExamined:4 docsExamined:4 hasSortStage:1 cursorExhausted:1 keyUpdates:0 writeConflicts:0 numYields:0 nreturned:2 reslen:342
From above log, we can see that MongoDB used the default index { userID: 1, city: 1 }, as changing $gte to $gt changed the query shape.
Now let’s examine if providing a hint for a query works, if we have index filter in place for that query:
db.users.find({"userID" : {"$gte": 1001}, "favDrink": "wine"}).sort({"city": 1}).hint({ userID: 1, city: 1 })
We provided the { userID: 1, city: 1 } index as a hint to our query.
[conn1] command test.users command: find { find: "users", filter: { userID: { $gte: 1001.0 }, favDrink: "wine" }, sort: { city: 1.0 }, hint: { userID: 1.0, city: 1.0 } } planSummary: IXSCAN { userID: 1.0, favDrink: 1.0 } keysExamined:6 docsExamined:1 hasSortStage:1 cursorExhausted:1 keyUpdates:0 writeConflicts:0 numYields:0 nreturned:1 reslen:221
From the log, it is clear that MongoDB used the { userID: 1, favDrink: 1 } index, it did not consider the index { userID: 1, city: 1 } that we specified in the hint.
We can use the planCacheListFilters command to get the list of index filters for a given collection:
db.runCommand( { planCacheListFilters : "users" })

Also we can run the planCacheClearFilters command to remove a specific index filter or all the index filters in a collection. To remove a specific index filter we have to specify the query shape. For our example:
db.runCommand(
{
planCacheClearFilters: "users",
"query" : {"userID" : {"$gte" : 1003},"favDrink" : "beer"},
"sort": {"city" : 1},
"projection": {}
} )

To clear all index filters on a collection, just omit the query shape in the planCacheClearFilters command:
db.runCommand({planCacheClearFilters: "users"})

Index filter is a very nice tool for optimizing MongoDB experience, so try it out and enjoy
.Friday, 20 May 2016
MongoDB Recipes: How to change MongoDB’s sort buffer size
When MongoDB could not use an index obtain the sort order for a query, then it sorts the results in memory. If the sort operation consumes more than 32 megabytes, MongoDB returns an error:
"Executor error during find command: OperationFailed: Sort operation used more than the maximum 33554432 bytes of RAM. Add an index, or specify a smaller limit."

As written in MongoDB document, to avoid this error we can either create an index supporting the sort operation or we can use sort() in conjunction with limit()
Also memory usage limit for sorts can be configured via the internalQueryExecMaxBlockingSortBytes parameter. In the following example I am setting the sort buffer size to 128MB:
> db.adminCommand({"setParameter": 1, "internalQueryExecMaxBlockingSortBytes" : 134217728})

Now my MongoDB will use 128MB memory for the sorts that could not use an index .
"Executor error during find command: OperationFailed: Sort operation used more than the maximum 33554432 bytes of RAM. Add an index, or specify a smaller limit."

As written in MongoDB document, to avoid this error we can either create an index supporting the sort operation or we can use sort() in conjunction with limit()
Also memory usage limit for sorts can be configured via the internalQueryExecMaxBlockingSortBytes parameter. In the following example I am setting the sort buffer size to 128MB:
> db.adminCommand({"setParameter": 1, "internalQueryExecMaxBlockingSortBytes" : 134217728})

Now my MongoDB will use 128MB memory for the sorts that could not use an index .
Thursday, 7 April 2016
MongoDB Recipes: MongoDB point-in-time recovery using oplog
MongoDB oplog is a capped collection that records all the data change operations in the databases. As the oplog is a capped collection, so it can record database changes only for a particular period of time.
Consider the following scenario:Say our oplog can store changes for last 24 hours. Our daily backup takes place at 3AM. Suppose one user fired a drop command by mistake, and dropped a collection at 11AM. To recover the dropped collection we can restore the backup of 3AM and then we can apply the oplog and recover it till 11AM (till the drop statement).
Again suppose if our oplog size is small and it can store changes only for 4 hours. In this case, we will not be able to perform the point-in-time recovery for the above scenario. So be sure that you have a large enough oplog or you take backup of your oplog frequently (before getting overwritten).
Oplog is enabled when we start a mongodb replica set. In case of standalone mongodb instance, if we need oplog then we can start the mongod instance as master (master-slave replication) or as a single node replica set.
In this example I am going to show the recovery process in a standalone mongodb instance. Also I am going to enable oplog in this instance by starting it as a master node of master-slave replication (using master-slave replication is not recommended, and it is recommended to use replica set. As here it is just for tutorial purpose, so I am using master-slave replication).
To start MongoDB with oplog in (master-slave replication) use the --master option.
mongod --config /etc/mongod.conf --master
I will create a collection mycoll in the database mydb with 10000 documents.

At this point we will take a backup, for backup I am going to use mongodump.
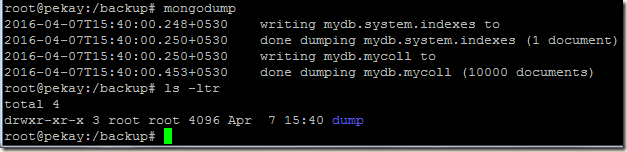
After taking backup, we will do some more changes in the database
Inserting another 10000 documents:

Update all the documents and increment the score of all the documents by 10:

Again add another 5000 documents:

We have 25,000 documents in our mycoll collection.
Now I will run a query that will remove 5000 documents.
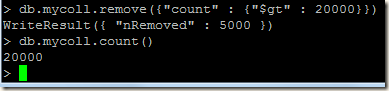
Lets suppose the above remove command was fired by mistake and we want to recover the deleted documents.
We have monogdump backup, but that backup was taken when the collection had only 10000 documents. So this backup will not be sufficient to recover the deleted documents. So we are going to use the oplog, our saviour .
.
Take backup of the oplog using mongodump:MongoDB stores oplog in the local database. The collection in which the oplog is stored depends on the replication type:
1) Using master-slave type replication: oplog is stored in oplog.$main collection
2) Using replica-set: oplog is stored in oplog.rs collection
For this example we are using master-slave replication, so I am taking mongodump backup of oplog.$main collection.

I created oplogbackup directory and in that directory I took mongodump of the oplog.$main collection.
Find the recovery point:As we have our mongod running and oplog available, we can query the oplog.$main collection and find the recovery point. We executed the delete command on mydb.mycoll collection, so our query will be as follows:
> d=db.getSiblingDB("local")
> d.oplog.$main.find({"ns":"mydb.mycoll","op":"d"}).sort({$natural: 1}).limit(5)
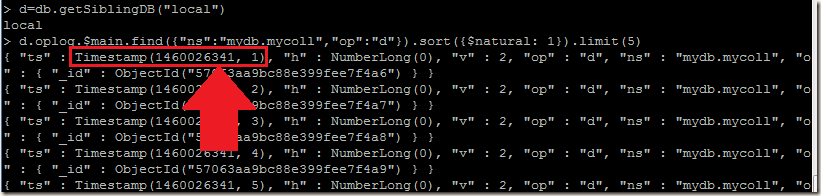
Our aim is to find the "ts" field for first delete operation. In our case it is "ts" : Timestamp(1460026341, 1). Note this value as 1460026341:1 and it is our recovery point, we will have to use this value in mongorestore.
Also we can run the bsondump tool to generate json file of our oplog backup and then searching the json file for the recovery point.
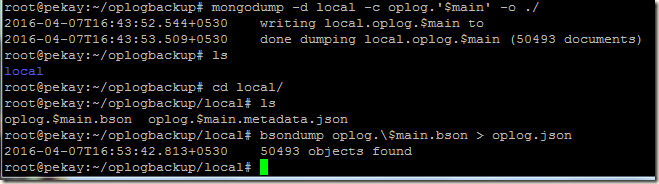
Recovering Database:
First I will restore the mongodump backup of the database. I am restoring the backup in a fresh mongod instance:
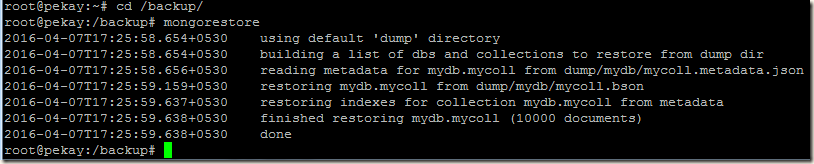
mongorestore command restored 10,000 documents of our mydb.mycoll collection. The remaining recovery will be done using the oplog backup.
We can replay oplog using the mongorestore command’s --oplogReplay option. To replay oplog, mongorestore command requires oplog file backup to be named as oplog.bson. So I am going to move and rename our oplog backup file oplog.$main.bson into another directory as oplog.bson.
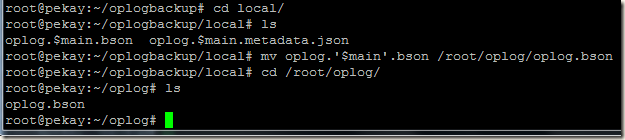
For point-in-time recovery, mongorestore has another option --oplogLimit. This option allows us to specify timestamp (in <seconds>[:ordinal] format). --oplogLimit instructs mongorestore to include oplog entries before the provided timestamp. So restore operation will run till the provided timestamp.
So running our oplog replay:

Database recovery is completed, now lets check the recovered data
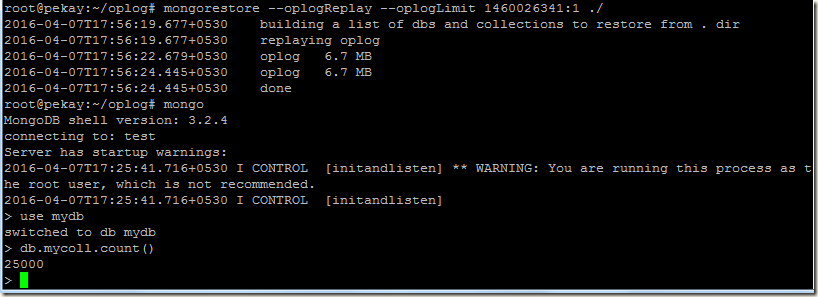
Yes, we can see all the 25,000 documents are back. So we are able to recover the 5,000 deleted documents.
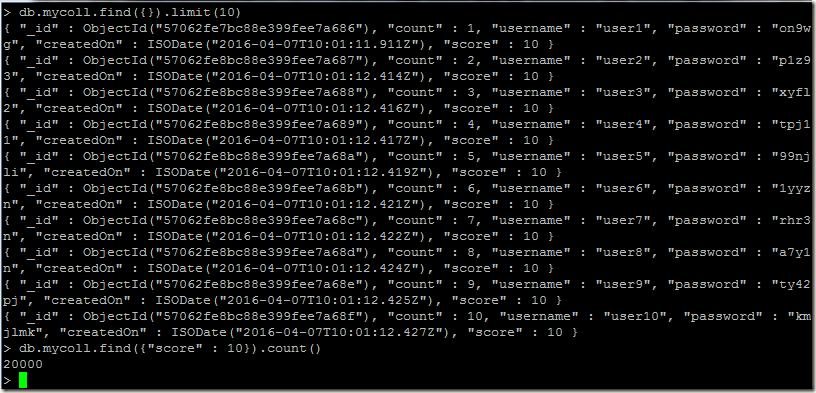
Also our updated 20,000 documents with incremented score of 10, also present .
So our point in time recovery is successful
Consider the following scenario:Say our oplog can store changes for last 24 hours. Our daily backup takes place at 3AM. Suppose one user fired a drop command by mistake, and dropped a collection at 11AM. To recover the dropped collection we can restore the backup of 3AM and then we can apply the oplog and recover it till 11AM (till the drop statement).
Again suppose if our oplog size is small and it can store changes only for 4 hours. In this case, we will not be able to perform the point-in-time recovery for the above scenario. So be sure that you have a large enough oplog or you take backup of your oplog frequently (before getting overwritten).
Oplog is enabled when we start a mongodb replica set. In case of standalone mongodb instance, if we need oplog then we can start the mongod instance as master (master-slave replication) or as a single node replica set.
Hands On:
Note: I have used MongoDB 3.2.4 on Ubuntu 14.04 for this tutorial.In this example I am going to show the recovery process in a standalone mongodb instance. Also I am going to enable oplog in this instance by starting it as a master node of master-slave replication (using master-slave replication is not recommended, and it is recommended to use replica set. As here it is just for tutorial purpose, so I am using master-slave replication).
To start MongoDB with oplog in (master-slave replication) use the --master option.
mongod --config /etc/mongod.conf --master
I will create a collection mycoll in the database mydb with 10000 documents.

At this point we will take a backup, for backup I am going to use mongodump.

After taking backup, we will do some more changes in the database
Inserting another 10000 documents:

Update all the documents and increment the score of all the documents by 10:

Again add another 5000 documents:

We have 25,000 documents in our mycoll collection.
Now I will run a query that will remove 5000 documents.

Lets suppose the above remove command was fired by mistake and we want to recover the deleted documents.
We have monogdump backup, but that backup was taken when the collection had only 10000 documents. So this backup will not be sufficient to recover the deleted documents. So we are going to use the oplog, our saviour
.Take backup of the oplog using mongodump:MongoDB stores oplog in the local database. The collection in which the oplog is stored depends on the replication type:
1) Using master-slave type replication: oplog is stored in oplog.$main collection
2) Using replica-set: oplog is stored in oplog.rs collection
For this example we are using master-slave replication, so I am taking mongodump backup of oplog.$main collection.

I created oplogbackup directory and in that directory I took mongodump of the oplog.$main collection.
Find the recovery point:As we have our mongod running and oplog available, we can query the oplog.$main collection and find the recovery point. We executed the delete command on mydb.mycoll collection, so our query will be as follows:
> d=db.getSiblingDB("local")
> d.oplog.$main.find({"ns":"mydb.mycoll","op":"d"}).sort({$natural: 1}).limit(5)

Our aim is to find the "ts" field for first delete operation. In our case it is "ts" : Timestamp(1460026341, 1). Note this value as 1460026341:1 and it is our recovery point, we will have to use this value in mongorestore.
Also we can run the bsondump tool to generate json file of our oplog backup and then searching the json file for the recovery point.

Recovering Database:
First I will restore the mongodump backup of the database. I am restoring the backup in a fresh mongod instance:

mongorestore command restored 10,000 documents of our mydb.mycoll collection. The remaining recovery will be done using the oplog backup.
We can replay oplog using the mongorestore command’s --oplogReplay option. To replay oplog, mongorestore command requires oplog file backup to be named as oplog.bson. So I am going to move and rename our oplog backup file oplog.$main.bson into another directory as oplog.bson.

For point-in-time recovery, mongorestore has another option --oplogLimit. This option allows us to specify timestamp (in <seconds>[:ordinal] format). --oplogLimit instructs mongorestore to include oplog entries before the provided timestamp. So restore operation will run till the provided timestamp.
So running our oplog replay:

Database recovery is completed, now lets check the recovered data

Yes, we can see all the 25,000 documents are back. So we are able to recover the 5,000 deleted documents.

Also our updated 20,000 documents with incremented score of 10, also present
.So our point in time recovery is successful