Recently one of our applications was facing one problem. Problem was
that it stops responding after running for some time mainly during load
period. I checked logs but could not find any clue about the problem.
After some observation I found that static pages were opening normally
and the problem was coming only in dynamic pages. So I was sure that the
problem is with the database connectivity and checked the JDBC
connection pool settings. But connection pool settings were OK, and then
I decided to enable monitoring of Glassfish. To enable monitoring go to
Configurations -> server-config -> Monitoring

Checked the Enabled checkbox next to the Monitoring Service
There are three Monitoring Levels (OFF, LOW, HIGH) defined for each individual component. Right now my main concern is about the JDBC Connection Pool, so I will make monitoring level HIGH against it and save the settings.

To check the monitored data go to the Monitor tab in server link

In the Monitor tab, the monitored data is grouped in different categories like Application, Server and Resources depending on the monitored data type. As I want the JDBC Connection Pool data so I have to go to the Resources tab.

When I checked the statistics for the connection pool, I found that a value of more than 100 for WaitQueueLength. This means that much of connection requests were in the queue. The maximum number of connections for that pool were already used, so the new connection requests were going to the queue. But as per my experience, the maximum number of connections for that pool was quite sufficient according to the load on the application. So I suspected connection leak, and I decided to enable connection leak monitoring for this connection pool.
To enable connection leak monitoring, go to the Advanced tab of the connection pool

To enable connection leak monitoring, enter a non-zero value for Leak Timeout. Default is 0 which means leak monitoring is disabled.
If we enable Leak Reclaim for the connection pool, then the leaked connections will be reclaimed by the pool after the connection leak timeout occurs.

After enabling connection leak monitoring, when I checked the monitored data after some time, I could see NumPotentialConnectionLeak had a value of 16. This means that some connection leak is occurring.

To find the details of the connection leaks, we can check the server log.

In the Log Viewer, go to Advanced Search

In Log Level select WARNING and in Logger list select javax.enterprise.resource.resourceadapter and search
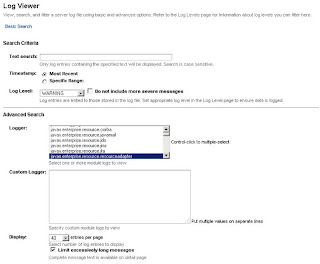
In the Log Viewer we can find information about the connection leaks

If we click on details link attached to each Message, we can see the details of each message

জয় আই অসম,
প্রণব শর্মা
2 comments:
Hi Pranab,
Thanks for the article, can you help to identify what should set value for timeout so that genuine connection should not killed.
I also want your help, how connection leak algorithm work?
Pranab'S Scrapbook: Using Glassfish Monitoring And Finding Jdbc Connection Leak >>>>> Download Now
>>>>> Download Full
Pranab'S Scrapbook: Using Glassfish Monitoring And Finding Jdbc Connection Leak >>>>> Download LINK
>>>>> Download Now
Pranab'S Scrapbook: Using Glassfish Monitoring And Finding Jdbc Connection Leak >>>>> Download Full
>>>>> Download LINK
Post a Comment