CopyDisable

Friday, 25 October 2013

Hands On: Deploying SSL certificate in Glassfish

In this hands on I will show you how to deploy comodo 90 days trial SSL certificate in Glassfish server.

For this I will mainly use java keytool command. First I will create the private key and a separate KeyStore (we may use the default keystore.jks KeyStore of glassfish) for this example.

The command is:

keytool -genkey -keysize 2048 -genkey -alias pranabtest.co.in -keyalg RSA  -keystore serverkeystore.jks

Suppose my site is pranabtest.co.in and I kept the alias for the private key same as my domain name. The command will ask for the password of this KeyStore, keep it same as the glassfish master password. Enter all the required information and  keep the private key’s password same as the KeyStore password to avoid any future issues.

image

We can view the keys in the KeyStore using the following command:

keytool -list -keystore serverkeystore.jks

image

Now I will generate CSR (certificate signing request) and submit it to receive our 90 days trial SSL certificate from comodo (or some other CA).

keytool -certreq -alias pranabtest.co.in -keystore serverkeystore.jks –file pranabtest.csr

The above command will create a file named pranabtest.csr. Copy the content of the file and submit it in the comodo site’s Provide your CSR page.

After finishing some steps, I will receive the SSL certificate, CA root and intermediate certificates in a zip file in my mail (e.g. pranabtest_co_in.zip).

This zip file contains five files: AddTrustExternalCARoot.crt, ComodoUTNSGCCA.crt, EssentialSSLCA_2.crt, UTNAddTrustSGCCA.crt and my site’s certificate pranabtest_co_in.crt

We have to import all the files into our KeyStore:

First I will import the CA root certificate. If this command returns that this certificate is already exists, then select no

keytool -import -alias root -keystore serverkeystore.jks -trustcacerts -file AddTrustExternalCARoot.crt


Then I will import the three intermediate CA certificates

keytool -import -alias comodo -keystore serverkeystore.jks -trustcacerts -file ComodoUTNSGCCA.crt
Certificate was added to keystore

keytool -import -alias essential -keystore serverkeystore.jks -trustcacerts -file EssentialSSLCA_2.crt
Certificate was added to keystore

keytool -import -alias utn -keystore serverkeystore.jks -trustcacerts -file UTNAddTrustSGCCA.crt
Certificate was added to keystore

Finally I will import the SSL certificate for my site:

Here remember to keep the same name for the alias (as the private key alias we created with the KeyStore), otherwise the validation chain will not get completed.

keytool -import –alias pranabtest.co.in -keystore serverkeystore.jks -trustcacerts –file pranabtest_co_in.crt
Certificate reply was installed in keystore

So our certificate installation is finished, now we have to tell Glassfish to use this certificate.

I changed the SSL settings for my 2nd http listener, in Certificate NickName enter the alias for our certificate (i.e. pranabtest.co.in) and also the Key Store name.

image


*******************************************************************************

2 minutes break story:

Once I made a mistake, I imported my site’s certificate with a different alias. Say I created my private key with alias pranabtest.co.in and imported my site’s certificate with alias pranabtest.public. I used the alias for my certificate pranabtest.public in Certificate NickName field of Glassfish HTTP listener’s SSL configuration. But I started getting the following error in my server.log

SSL support could not be configured!
java.io.IOException: SSL configuration is invalid due to No available certificate or key corresponds to the SSL cipher suites which are enabled.

and

ProtocolChain exception java.lang.NullPointerException

The solution was to delete my site’s certificate from the KeyStore (i.e. delete pranabtest.public) and import it again (with alias pranabtest.co.in).

End of 2 minutes break story

*******************************************************************************


Next I will stop the Glassfish domain, and take backup of the domain.xml file. Then replace all occurrence of s1as (certificate nickname) with pranabtest.co.in which is the certificate alias and keystore.jks with my new KeyStore serverkeystore.jks in domain.xml file.

Start Glassfish and open the site using the secured port.

Tuesday, 1 October 2013

Glassfish Monitor

I have written a Glassfish Monitor (using shell scripting, PHP and MySQL), to help myself to monitor the Glassfish Application server’s resource usage as well as the server resource usage.

The setup of this monitor is very simple, just unzip the file and copy the files to some folder say /root/server_monitor folder.

clip_image001

After copying, run the setup_glassfish_monitor.sh script as root user using the command:

# sh setup_glassfish_monitor.sh

The script will ask for Glassfish admin username and password.

clip_image003

The setup script adds a cron job, which is scheduled to run every 15 minutes and to collect the server statistics and add it to some centralized MySQL database server.

clip_image004

Types of Monitoring:

The tool can do the following types of monitoring:

1) Checking whether Glassfish process is running, and sending email alert if the process is not running.
clip_image006

2) Checking High Memory usage and if memory usage is above a specified threshold, then alert email is sent.
clip_image008

3) Checking High CPU usage and sending email alert if CPU usage is above specified threshold.
clip_image010

4) Checking if Server is swapping and sending alert if the server is swapping
clip_image012

Few more monitoring options I will add in future.


Configurations

We can configure the following parameters in the tool:
1) Change the CPU/RAM utilization % threshold for receiving alerts. Default value is 90%.
2) Change the frequency at which the alert will be sent to the receivers.
Note: The script will run every 5 minutes but if we set $alert_sent_every parameter to 30, then if some issue is detected, then immediately alert will be sent to the receivers but if the issue persists then the next alert will go only after  $alert_sent_every minutes i.e. after 30 minues, not every 5 minutes.

3) Set the alert receivers by editing $mail_ids parameter. Multiple recipients separated by ; (semicolon) .

4) Change the DB server settings in this file, these settings are for storing the server status to the centralized server for reporting/analysis.


clip_image014


Latest Monitoring data in web browser

We can monitor the server status from our web browser.

clip_image016

After we open the reporting link for this tool, we have to select the server which we want to monitor, so using this tool we can keep an eye on all the Glassfish servers from a single web page.

Select the server name and click on Save clip_image017button to load the latest monitoring data for the selected server.

If you select Auto Refresh clip_image018On, and click save then after every Refresh Interval clip_image019 minutes, the latest monitored data will be loaded in the browser automatically and previous loaded data will be pushed towards the bottom of the browser.

clip_image021

Also we can manually load the latest monitored data for the selected server, using the Refresh clip_image022button, which is enabled after we select and save a particular server.

In the below screenshot we can see that our auto refreshed data is loaded in the browser, now we can see and compare the latest data with the previously collected data.

clip_image024


Quick Overviews

After selecting a server we can see some new links, this links provide quick overview of few monitoring entities:
We can see monitoring data for last 3 hours, (12 monitoring collections, 12x15 Minutes = 3 Hours status)

1) Server CPU Usage clip_image025:
clip_image027

2) Server’s available free memory clip_image028
clip_image030

3) Memory Usage by Glassfish processclip_image031
clip_image033

4) Heap Usage by Glassfish JVM clip_image034
clip_image036

5) Non-Heap memory used by Glassfish JVM clip_image037
clip_image039

6) JVM threads created by Glassfish JVM clip_image040
clip_image042


Reports:

If I click on Menu link, I can see the links for different reports
clip_image043

To create a report you have to

· Select the server clip_image044

· Select report start date and time
clip_image045

· Select report end date and time
clip_image046

· Select number of records that you want to see in the report page
clip_image047

Click on the Go clip_image048button to generate the report

1) Free Memory Report:
This report is useful for keeping an eye on memory utilization of the server and finding whether we have sufficient RAM or whether we have over provisioned server RAM.
clip_image050

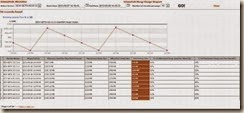
2) CPU Usage Report
Using this report we can see the CPU usage of the server over a period of time. This will help to estimate the load on the server. Here also we can find the % of CPU used by Glassfish out of the whole server CPU usage.
clip_image052

3) Glassfish Memory Usage Report
Here we can see the memory usages of the Glassfish JVM process.
clip_image054

4) Glassfish Heap Usage Report:
Here we can find the JVM heap usages. Here we can see the free available space in the heap, allocated heap size and usage %. This may help us to size the heap correctly.
clip_image056

5) Glassfish Non-Heap Usage Report:
Here we can monitor the Non-Heap usage of the Glassfish JVM
clip_image058

6) Glassfish Thread Usage Report:
Here we can see the JVM threads statistics.
clip_image060

7) Glassfish Classloading Report
Class Loading statistics can be generated from this report.
clip_image062

This is a small tool but can be very handy.

My next plan is to write a heap sizing advisor (sizing different heap areas Eden Space, two Survivor Spaces and the OldGen space), but all depends on how much free time Almighty will provide me Smile.