I have written a Glassfish Monitor (using shell scripting, PHP and MySQL), to help myself to monitor the Glassfish Application server’s resource usage as well as the server resource usage.
The setup of this monitor is very simple, just unzip the file and copy the files to some folder say /root/server_monitor folder.
After copying, run the setup_glassfish_monitor.sh script as root user using the command:
# sh setup_glassfish_monitor.sh
The script will ask for Glassfish admin username and password.
The setup script adds a cron job, which is scheduled to run every 15 minutes and to collect the server statistics and add it to some centralized MySQL database server.
Types of Monitoring:
The tool can do the following types of monitoring:
1) Checking whether Glassfish process is running, and sending email alert if the process is not running.
2) Checking High Memory usage and if memory usage is above a specified threshold, then alert email is sent.
3) Checking High CPU usage and sending email alert if CPU usage is above specified threshold. 
4) Checking if Server is swapping and sending alert if the server is swapping
Few more monitoring options I will add in future.
Configurations
We can configure the following parameters in the tool:
1) Change the CPU/RAM utilization % threshold for receiving alerts. Default value is 90%.
2) Change the frequency at which the alert will be sent to the receivers.
Note: The script will run every 5 minutes but if we set $alert_sent_every parameter to 30, then if some issue is detected, then immediately alert will be sent to the receivers but if the issue persists then the next alert will go only after $alert_sent_every minutes i.e. after 30 minues, not every 5 minutes.
3) Set the alert receivers by editing $mail_ids parameter. Multiple recipients separated by ; (semicolon) .
4) Change the DB server settings in this file, these settings are for storing the server status to the centralized server for reporting/analysis.
Latest Monitoring data in web browser
We can monitor the server status from our web browser.
After we open the reporting link for this tool, we have to select the server which we want to monitor, so using this tool we can keep an eye on all the Glassfish servers from a single web page.
Select the server name and click on Save button to load the latest monitoring data for the selected server.
If you select Auto Refresh On, and click save then after every Refresh Interval
minutes, the latest monitored data will be loaded in the browser automatically and previous loaded data will be pushed towards the bottom of the browser.
Also we can manually load the latest monitored data for the selected server, using the Refresh button, which is enabled after we select and save a particular server.
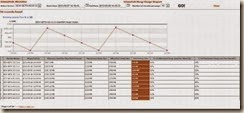
In the below screenshot we can see that our auto refreshed data is loaded in the browser, now we can see and compare the latest data with the previously collected data.
Quick Overviews
After selecting a server we can see some new links, this links provide quick overview of few monitoring entities:
We can see monitoring data for last 3 hours, (12 monitoring collections, 12x15 Minutes = 3 Hours status)
2) Server’s available free memory 
3) Memory Usage by Glassfish process
4) Heap Usage by Glassfish JVM 
5) Non-Heap memory used by Glassfish JVM 
6) JVM threads created by Glassfish JVM 
Reports:
If I click on Menu link, I can see the links for different reports
To create a report you have to
· Select report start date and time
· Select report end date and time
· Select number of records that you want to see in the report page
Click on the Go button to generate the report
1) Free Memory Report:
This report is useful for keeping an eye on memory utilization of the server and finding whether we have sufficient RAM or whether we have over provisioned server RAM.
2) CPU Usage Report
Using this report we can see the CPU usage of the server over a period of time. This will help to estimate the load on the server. Here also we can find the % of CPU used by Glassfish out of the whole server CPU usage.
3) Glassfish Memory Usage Report
Here we can see the memory usages of the Glassfish JVM process. 
4) Glassfish Heap Usage Report:
Here we can find the JVM heap usages. Here we can see the free available space in the heap, allocated heap size and usage %. This may help us to size the heap correctly.
5) Glassfish Non-Heap Usage Report:
Here we can monitor the Non-Heap usage of the Glassfish JVM
6) Glassfish Thread Usage Report:
Here we can see the JVM threads statistics. 
7) Glassfish Classloading Report
Class Loading statistics can be generated from this report.
This is a small tool but can be very handy.
My next plan is to write a heap sizing advisor (sizing different heap areas Eden Space, two Survivor Spaces and the OldGen space), but all depends on how much free time Almighty will provide me .


2 comments:
Pranab,
Awesome document...
--Manoj
Looking for Norton Support visit our website or reffer our blog for Norton Antivirus trouble shooting "norton security tech norton internet security login sonar protection not fixed windows 10
"
Post a Comment